Tasks
Analysis of univariate random variables
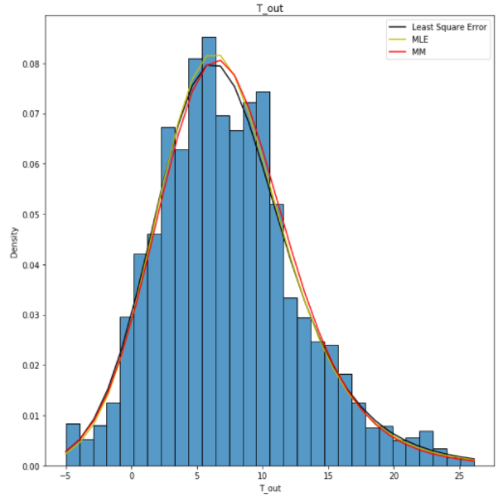
In the figure, we can see an estimation of distribution to a random variable found by three methods, LSE, MLE, and MM.
The main goal of this task is to estimate the distribution function of a univariate random variable.
In order to acheive that, I've applied several steps:
First, plotting a non-parametric estimation of PDF because it helps determine the likelihood of the random variable falling within a specific range of values.
Then, by plotting “box with whiskers” we can gain a more statistics estimation and find the outliers in the data.
After that, we can expect a theoretical distributions that best reflect the empirical data.
So, then we can estimate the random variable distribution parameters using maximum likelihood technique and Least Sequares methods.
Finally, a validation of empirical and theoretical distributions is performed using quantile biplots, in addition to some statistical tests.
Analysis of multivariate random variables
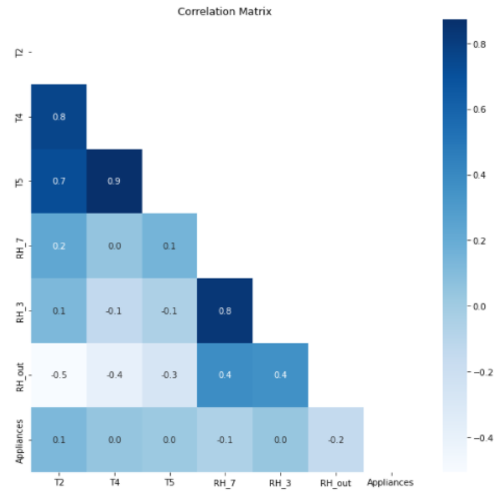
In the figure, we can see a correlation matrix for the random variables in the target data.
The main goal of this task is to find a model that can relate between the target and predictors in the data
In order to acheive that, I've applied several steps:
First, to understand the relationsgips among different variables I have estimated multivariate mathematical expectation and variance.
In addition to estimation of conditional distributions, mathematical expectations and variances.
After that, to unserstand the statistical relationship among different variables, I have estimated pair correlation coefficients,
So, the relationship among the target and predictors is represented by a regression model.
Finally, a quality analysis is performed to check the quality of the found models.
Sampling of multivariate random variable
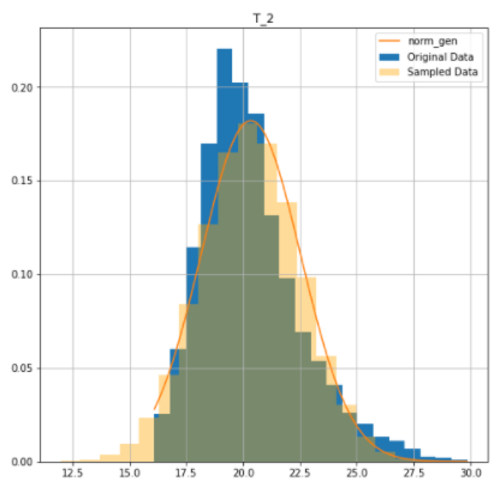
In the figure, we can see the original and sampled data of a specific variable.
The main goal of this task is to sample multivariate random variable.
In order to acheive that, I've applied several steps:
First, sampling of chosen target variables using univariate parametric distributions with two different sampling methods: Inverse transform sampling, and Accept-Reject Sampling.
Then perform multivariate sampling between predictors and chosen target variables, by different methods: Manual Bayesian network, and Structural learning models.
Finally, a quality analysis is performed to check the quality of the found models.
Stationarity of the processes
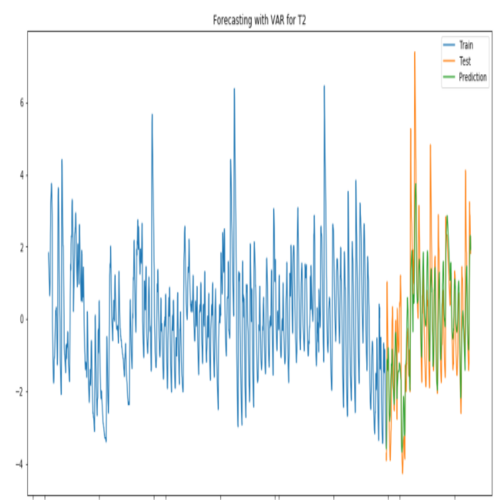
In the figure, we can a forecast model for a specific random variable.
The main goal of this task is to apply forecasting for random variables
In order to acheive that, I've applied several steps:
First, It is important to analyze the substantiation and stationary of the chosen variables.
Then, according to the result of the previous step, noise filtration may be required.
After that, an auto-regression model (SARIMA model) was trained for the target variables.
Finally, we can forecast the data for the target variables.